introduction to computer graphics
introduction
Computer graphics is a field within visual computing that involves the creation, manipulation, and
presentation of visual content using computers. It encompasses a broad spectrum of applications, including
the generation of 2D and 3D images, animations, graphical user interfaces (GUIs), scientific data
visualization, and virtual environment simulations. Here are some key aspects of computer graphics:
1. Rendering Techniques: Rendering is the process of generating images from
geometric models and scene
descriptions. It involves various techniques such as rasterization, ray tracing, and global illumination,
each with distinct advantages and limitations.
2. 2D and 3D Graphics: Computer graphics can produce both two-dimensional
(2D) and three-dimensional
(3D) imagery. While 2D graphics are commonly used for interfaces, icons, and digital art, 3D graphics enable
the creation of immersive virtual environments, gaming worlds, and realistic simulations.
3. Modeling and Animation: Modeling entails creating digital representations
of objects, characters, or
environments using mathematical techniques. Animation involves adding motion to these models, creating
sequences of frames that simulate movement.
4. Interactive Graphics: Interactive graphics allow users to interact with
visual content in real-time.
This includes applications like video games, virtual reality (VR), augmented reality (AR), and interactive
data visualization tools.
5. Graphics APIs and Libraries: Graphics APIs (Application Programming
Interfaces) such as OpenGL,
DirectX, Vulkan, and WebGL provide developers with tools to interact with graphics hardware and create
graphical applications efficiently. Additionally, numerous graphics libraries and frameworks are available
to simplify common tasks in graphics programming.
6. Applications in Various Fields: Computer graphics find applications in
diverse fields such as
entertainment (movies, video games), design (architecture, industrial design), education (interactive
simulations, e-learning), science (visualization of scientific data), medicine (medical imaging, surgical
simulations), and more.
7. Challenges and Advancements: Advances in computer graphics technology
continue to push the boundaries
of visual fidelity, realism, and interactivity. Challenges include rendering complex scenes in real-time,
achieving photorealistic graphics, simulating realistic physics, and optimizing performance for different
hardware platforms.
Overall, computer graphics play a vital role in modern computing by enabling the creation of visually
compelling content and enhancing user experiences across various domains.
interactive graphics
Interactive graphics are a type of visual content that allows users to actively engage with it, modifying or
manipulating elements in real-time. These graphics enable users to interact with digital environments,
objects, or data and receive immediate feedback based on their actions. They find applications in various
fields such as video games, simulations, virtual reality (VR), augmented reality (AR), data visualization
tools, and user interfaces.
Advantages of interactive graphics include:
1. Engagement: Interactive graphics enhance user engagement by allowing users
to actively participate
and influence the content. This engagement can lead to increased interest, enjoyment, and immersion in the
experience.
2. Customization: Users can tailor the visual content to suit their
preferences or needs. They can
adjust parameters, manipulate objects, or explore different viewpoints, providing a personalized experience.
3. Immediate Feedback: Interactive graphics provide immediate feedback to
user actions, enabling them to
understand the consequences of their interactions in real-time. This feedback loop fosters learning,
experimentation, and problem-solving.
4. Enhanced Communication: Interactive graphics can convey complex
information more effectively than
static visuals. Users can explore data interactively, gaining insights and understanding relationships that
may not be apparent in traditional formats.
5. User Empowerment: By allowing users to control and interact with the
content, interactive graphics
empower them to explore, create, and express themselves. This sense of agency can increase motivation and
satisfaction with the experience.
6. Simulation and Training: Interactive graphics are valuable for simulating
real-world scenarios and
providing hands-on training in a safe and controlled environment. Users can practice skills, make decisions,
and learn from their mistakes without real-world consequences.
7. Collaboration: Interactive graphics facilitate collaboration among users
by enabling real-time
interaction and communication. Collaborators can work together on shared tasks, explore ideas, and discuss
findings within the interactive environment.
Overall, interactive graphics offer a dynamic and engaging way for users to interact with digital
content,
providing numerous advantages in terms of engagement, customization, feedback, communication, empowerment,
simulation, training, and collaboration.
Representative Uses of Computer graphics
A representative application of computer graphics lies within the domain of video game development. Below
are ways in which computer graphics are utilized in this field:
1. Visual Realism : Computer graphics are instrumental in crafting realistic
environments, characters,
and objects within video games. Advanced rendering techniques such as ray tracing, ambient occlusion, and
physically based rendering are harnessed to achieve lifelike visuals, encompassing detailed textures,
lighting effects, and animations.
2. Immersive Gameplay : Graphics contribute significantly to crafting
immersive gameplay experiences.
High-quality graphics elevate players' immersion by offering visually captivating worlds, engaging
characters, and dynamic interactions. This immersion heightens players' enjoyment and fosters emotional
engagement with the game.
3. Artistic Expression : Video game developers leverage computer graphics to
articulate their artistic
visions through creative design elements, encompassing stylized characters, environments, and visual
effects. Art direction, color palettes, and visual storytelling techniques are utilized to convey mood,
atmosphere, and narrative themes.
4. User Interface (UI) : Graphics are pivotal in designing user-friendly
interfaces (UI) that enhance
players' experiences and facilitate interaction with the game. UI elements like menus, heads-up displays
(HUD), icons, and interactive prompts are visually crafted to be aesthetically pleasing, easy to navigate,
and informative.
5. Visualization of Game Mechanics : Computer graphics aid in visualizing
game mechanics, including
physics simulations, particle effects, and procedural generation. Visual feedback aids players in
comprehending game rules, making strategic decisions, and responding to dynamic gameplay situations.
6. Cutscenes and Cinematics : Graphics are employed to create cinematic
sequences and cutscenes that
propel the game's narrative, emphasize crucial plot points, and showcase memorable moments. These scripted
events frequently feature high-quality animations, camera angles, and special effects to deliver compelling
storytelling experiences.
7. Multiplayer and Online Gaming : In multiplayer and online gaming, graphics
play a critical role in
ensuring consistency across players' experiences. Networked graphics techniques guarantee synchronized
rendering of game elements, seamless animations, and minimal latency for a cohesive multiplayer gaming
encounter.
In summary, computer graphics are indispensable in video game development, enabling the creation of visually
stunning, immersive, and engaging gaming experiences that captivate players and transport them into virtual
worlds.
Classification of Application Development of Hardware and software for Computer Graphics
Hardware Development:
1. Graphics Processing Units (GPUs) :
- GPUs, specialized hardware units, accelerate graphics rendering tasks. They come in various forms:
integrated GPUs within CPUs, discrete GPUs, and specialized ones for gaming or professional applications.
2. Graphics Cards :
- Graphics cards house GPUs and feature components like video memory (VRAM) and cooling systems. They're
categorized based on performance, memory capacity, and intended use (e.g., gaming, content creation).
3. Input Devices :
- These devices interact with graphical content, including graphics tablets, styluses, motion controllers,
and 3D input devices. Their classification is based on sensing technology and form factor.
4. Display Devices :
- Display devices like monitors, projectors, VR headsets, and AR glasses vary in resolution, refresh rate,
display technology, and intended use.
Software Development:
1. Graphics APIs (Application Programming Interfaces) :
- APIs like DirectX, OpenGL, Vulkan, Metal, and WebGL facilitate interaction with graphics hardware. They're
classified by platform support, features, and performance.
2. Graphics Libraries and Frameworks :
- These abstract low-level graphics programming tasks, aiding developers. Examples are OpenGL Utility
Toolkit (GLUT), DirectX Tool Kit, Three.js, and Unity.
3. Integrated Development Environments (IDEs) :
- IDEs such as Visual Studio, Xcode, Eclipse, and JetBrains IDEs offer tools for graphical application
development, including code editors, compilers, and debuggers.
4. Content Creation Software :
- These tools create and manipulate graphical assets, including Adobe Photoshop, Blender, Autodesk Maya,
Cinema 4D, and Adobe After Effects.
5. Game Engines :
- Frameworks like Unreal Engine, Unity, CryEngine, and Godot Engine aid in developing video games and
interactive simulations.
6. Simulation and Visualization Tools :
- Tools like MATLAB, VTK (Visualization Toolkit), ParaView, and ANSYS Fluent assist in scientific and
architectural visualization, virtual prototyping, and physical simulation.
7. Operating Systems :
- Operating systems like Windows, macOS, Linux distributions, Android, and iOS support graphical
applications and manage hardware resources.
Classification Criteria:
- Performance: Hardware and software are classified based on rendering speed, frame rates,
resolution
support, and scalability.
- Use Cases: Applications are categorized based on use cases like gaming, professional design,
scientific visualization, and virtual reality.
- Compatibility: Hardware and software may be classified by their compatibility with different
platforms, including desktop computers, mobile devices, game consoles, and embedded systems.
- Development Environment: Tools are categorized based on programming languages, IDE
integrations, and
deployment options.
In summary, application development for computer graphics involves diverse hardware and software components,
each serving specific roles. Classification criteria include performance, use cases, compatibility, and
development environment requirements.
Conceptual Framework for Interactive Graphics
1. User Interaction Models::
- Describes the methods through which users interact with graphical content, including input devices,
interaction techniques (e.g., direct manipulation, gestures), and user interface paradigms (e.g., GUI, VR
interfaces).
2. rendering Techniques:
- Encompasses various methods for generating and displaying graphical content, such as rasterization, ray
tracing, vector graphics, and procedural generation. Also includes optimization techniques for real-time
rendering.
3. graphics APIs and Libraries:
- Refers to the software interfaces and libraries utilized for interacting with graphics hardware, including
DirectX, OpenGL, Vulkan, WebGL, and associated libraries and frameworks.
4. simulation and Physics:
- Focuses on simulating physical phenomena and behaviors within interactive graphics environments, such as
collision detection, rigid body dynamics, fluid dynamics, and particle systems.
5. animation and Motion:
- Addresses techniques for animating objects and characters within interactive graphics, including keyframe
animation, skeletal animation, procedural animation, and physics-based animation.
6. ser Interface Design:
- Covers principles and methodologies for designing intuitive and user-friendly interfaces for interactive
graphics applications, encompassing layout design, visual hierarchy, affordances, and feedback mechanisms.
7. real-Time Interaction:
- Involves techniques for achieving real-time responsiveness in interactive graphics applications, including
efficient rendering algorithms, input handling, event-driven programming, and optimization strategies.
8. ata Visualization:
- Focuses on methods for representing and visualizing data in interactive graphics applications, including
charts, graphs, maps, and other visualizations for scientific, analytical, and informational purposes.
9. multi-Modal Interaction:
- Refers to the integration of multiple modes of interaction, such as touch, voice, gesture, and motion, to
enhance user engagement and accessibility in interactive graphics applications.
10. Virtual and Augmented Reality:
- Encompasses the principles and technologies behind virtual reality (VR) and augmented reality (AR)
systems, including immersive environments, spatial tracking, mixed reality, and user interaction in virtual
spaces.
11. Game Development:
- Addresses the specific considerations and techniques for developing interactive graphics applications in
the context of video games, including game engines, mechanics, level design, and player engagement.
12. Usability and User Experience (UX):
- Focuses on evaluating and optimizing the usability and user experience of interactive graphics
applications, including user testing, feedback analysis, and iterative design processes.
13. Ethical and Social Implications:
- Considers the ethical, cultural, and societal implications of interactive graphics technologies, including
privacy concerns, accessibility, representation, and digital ethics.
By integrating these components into a cohesive framework, developers and researchers can better understand,
design, and implement interactive graphics systems that effectively engage users and achieve their intended
goals.
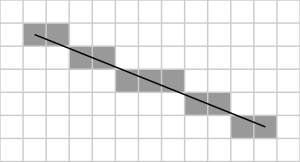
Scan converting lines
Scan converting lines entails identifying the pixels on the display screen that need illumination to depict the line accurately. A prevalent method for this task is the Bresenham's line algorithm. This algorithm efficiently computes the pixels to be activated to approximate a straight line between two specified points. Its efficiency stems from its reliance solely on integer arithmetic, eliminating the need for floating-point calculations.
Scan converting lines is a fundamental operation in computer graphics for drawing straight lines on a raster display. It involves determining which pixels should be activated to approximate the line between two given points.
Bresenham's line algorithm is a commonly employed method for scan converting lines. Renowned for its efficiency, this algorithm operates solely on integer arithmetic, avoiding the need for computationally expensive floating-point operations.
Here's a concise breakdown of Bresenham's line algorithm:
 1. Given two endpoints of a line, (x1, y1) and (x2, y2), with (x1 < x2) and (y1 < y2), calculate the line's slope, m.
2. Determine the direction to step along the x-axis (either increment x or decrement x) based on the slope and compute the decision parameter, d.
3. Initiate from the starting point (x1, y1), traverse each pixel along the line, incrementing the x-coordinate in the chosen direction and updating the y-coordinate according to the decision parameter.
4. Select the next pixel by minimizing the deviation from the ideal line based on the decision parameter.
5. Repeat this process until reaching the endpoint (x2, y2).
Bresenham's algorithm efficiently approximates the ideal straight line between two endpoints by minimizing error at each step. Its simplicity, speed, and suitability for real-time rendering have made it a widely adopted method in computer graphics.
Scan Converting Circles
Converting circles into a pixel representation involves determining which pixels should be illuminated to approximate the circle accurately. A widely used technique for this purpose is the midpoint circle algorithm. This method iteratively plots points along the circle's circumference, ensuring symmetry and smoothness.
Midpoint Circle Algorithm
The Midpoint Circle Algorithm is a commonly employed technique for determining the points along the perimeter of a circle. It offers an efficient approach that doesn't rely on trigonometric calculations or floating-point operations, making it well-suited for digital systems.
Here's a breakdown of the Midpoint Circle Algorithm:
1. Initialization: Begin with the circle's center coordinates ((xc , yc)) and its radius (r). Set the initial point at ((0, r)).
2. Decision Parameter ((P)): Define a decision parameter (P k ) to guide the selection of the next pixel to plot. For a circle with center ((xc , yc)) and radius (r), initialize (P 0 = 1 - r).
3. Plotting Points: At each step, plot the current point ((x, y)) and utilize symmetry to plot points in the other octants.
4. Updating Decision Parameter: Adjust the decision parameter based on the current point's position relative to the circle's circumference. There are two scenarios to consider: - If (P k < 0), the next point lies inside the circle, so (P k+1 = P k + 2x + 3). - If (P k geq 0), the next point lies outside the circle, so (P k+1 = P k + 2(x - y) + 5).
5. Iterative Process: Continue plotting points and updating the decision parameter until \(x\) becomes greater than or equal to (y), indicating that the entire circle has been plotted.
6. Symmetry: Exploit the circle's symmetry to compute only one-eighth of its circumference, replicating the plotted points in the other octants.
Through adherence to this algorithm, one can efficiently generate points situated along a circle's perimeter. Its straightforwardness and efficiency render the Midpoint Circle Algorithm a popular choice in computer graphics applications, such as circle rendering on displays or circular pattern generation.
c/c++ code
                void drawCircle(int x_center, int y_center, int radius) {
                    int x = 0;
                    int y = radius;
                    int decision = 1 - radius;

                    while (x <= y) {
                        plotPoints(x_center, y_center, x, y); // Plot the points using symmetry

                        if (decision < 0)
                            decision += 2 * x + 3;
                        else {
                            decision += 2 * (x - y) + 5;
                            y--;
                        }
                        x++;
                    }
                }

                void plotPoints(int x_center, int y_center, int x, int y) {
                    // Plot points using symmetry
                    plotPixel(x_center + x, y_center + y);
                    plotPixel(x_center - x, y_center + y);
                    plotPixel(x_center + x, y_center - y);
                    plotPixel(x_center - x, y_center - y);
                    plotPixel(x_center + y, y_center + x);
                    plotPixel(x_center - y, y_center + x);
                    plotPixel(x_center + y, y_center - x);
                    plotPixel(x_center - y, y_center - x);
                }
Scan Converting Ellipses
Scan converting ellipses involves the process of determining which pixels to color in order to represent the shape of an ellipse on a digital display. One commonly used algorithm for this task is the Midpoint Ellipse Algorithm. Here's a simplified explanation of how it works:
1. Initialization: Begin with the center coordinates ((xc , yc)) and the semi-major and semi-minor axes of the ellipse (a) and (b).
2. Decision Parameter: A decision parameter, (P k ), is defined to guide the selection of the next pixels to plot. Its initial value is computed based on the ellipse equation and its bounding box.
3. Plotting Points: Utilize symmetry properties to plot points in all octants of the ellipse. Each pixel's position relative to the ellipse boundary is determined using the decision parameter.
4. Updating Decision Parameter: Adjust the decision parameter iteratively to determine the next pixel to plot. Its value is incremented or decremented based on the ellipse's slope at the current point.
5. Iterative Process: Continue plotting points and updating the decision parameter until the entire ellipse boundary is approximated. The process stops when the slope of the tangent at the current point exceeds a specified threshold.
6. Symmetry: Exploit the ellipse's symmetry to reduce computational overhead. Plot points in one quadrant and mirror them across other quadrants.
The Midpoint Ellipse Algorithm efficiently renders ellipses on digital displays without relying on complex mathematical operations. Following this algorithm ensures accurate representation of ellipses in computer graphics applications.
I know guys above three topics are quite complicated :(
Comments
Post a Comment
write your complements and complaints :)